Matlab工具箱

一些奇怪的绘图方法:

https://blog.csdn.net/vv_eve/article/details/107592978

matlab自定义曲线拟合

  • 定义想要拟合的曲线函数:

以function的形式定义,参数以beta->list传入,例如:

function Phi = myfun1(beta,P)
    M = 10^((-8-30)/10)*0.35;
    a = beta(1);
    b = beta(2);
    Phi = M./((exp(a*b)/(1+exp(a*b))).*(1+exp(-a.*(P-b))))-M/exp(a*b);
end
  • 喂数据进行拟合,得到参数值:

在喂入数据的时候,需要给初始值。就目前我实验的结果而言,初始值极大程度影响最终拟合结果。

beta = nlinfit(x, y, @myfun1,[20000,0.0001])

返回的beta就是最后拟合的参数值。

结构体

定义

y=struct(key1,value1,key2,value2...)的形式定义:

title_mapping=struct('AA_IS', 'AA-IS',...
    'AA_SA', 'AA-SA', ...
    'AA_minVar', 'AA-SS_{minVar}',...
    'AA_maxE','AA-SS_{maxE}',...
    'APS_EMW', 'APS-EMW');

遍历

fileds = fieldnames(title_mapping);
for i=1:length(fileds)
    k = fileds(i);
    key = k{1};
    value = title_mapping.(key);
end

字符串

字符串用 “ “ 字符用 ‘ ‘

name_space = ["Method1", "Method2"];
save(['My_',char(name_space(1),'.mat')], 'Variable_name')

子图 subplot

子图的自由调节

function [ha, pos] = tight_subplot(Nh, Nw, gap, marg_h, marg_w)

% tight_subplot creates "subplot" axes with adjustable gaps and margins
%
% [ha, pos] = tight_subplot(Nh, Nw, gap, marg_h, marg_w)
%
%   in:  Nh      number of axes in hight (vertical direction)
%        Nw      number of axes in width (horizontaldirection)
%        gap     gaps between the axes in normalized units (0...1)
%                   or [gap_h gap_w] for different gaps in height and width 
%        marg_h  margins in height in normalized units (0...1)
%                   or [lower upper] for different lower and upper margins 
%        marg_w  margins in width in normalized units (0...1)
%                   or [left right] for different left and right margins 
%
%  out:  ha     array of handles of the axes objects
%                   starting from upper left corner, going row-wise as in
%                   subplot
%        pos    positions of the axes objects
%
%  Example: ha = tight_subplot(3,2,[.01 .03],[.1 .01],[.01 .01])
%           for ii = 1:6; axes(ha(ii)); plot(randn(10,ii)); end
%           set(ha(1:4),'XTickLabel',''); set(ha,'YTickLabel','')

% Pekka Kumpulainen 21.5.2012   @tut.fi
% Tampere University of Technology / Automation Science and Engineering

if nargin<3; gap = .02; end
if nargin<4 || isempty(marg_h); marg_h = .05; end
if nargin<5; marg_w = .05; end
if numel(gap)==1; 
    gap = [gap gap];
end
if numel(marg_w)==1; 
    marg_w = [marg_w marg_w];
end
if numel(marg_h)==1; 
    marg_h = [marg_h marg_h];
end

axh = (1-sum(marg_h)-(Nh-1)*gap(1))/Nh; 
axw = (1-sum(marg_w)-(Nw-1)*gap(2))/Nw;

py = 1-marg_h(2)-axh; 
% ha = zeros(Nh*Nw,1);
ii = 0;
for ih = 1:Nh
    px = marg_w(1);
    
    for ix = 1:Nw
        ii = ii+1;
        ha(ii) = axes('Units','normalized', ...
            'Position',[px py axw axh], ...
            'XTickLabel','', ...
            'YTickLabel','');
        px = px+axw+gap(2);
    end
    py = py-axh-gap(1);
end
if nargout > 1
    pos = get(ha,'Position');
end
ha = ha(:);
%% INITIALIZATION
clear all;
close all;
clc

%% INPUT TIGHTPLOT PARAMETERS
TightPlot.ColumeNumber = 3;     % 子图行数
TightPlot.RowNumber = 2;    % 子图列数
TightPlot.GapW = 0.09;  % 子图之间的左右间距
TightPlot.GapH = 0.1;   % 子图之间的上下间距
TightPlot.MarginsLower = 0.1;   % 子图与图片上方的间距
TightPlot.MarginsUpper = 0.03;  % 子图与图片下方的间距
TightPlot.MarginsLeft = 0.06;   % 子图与图片左方的间距
TightPlot.MarginsRight = 0.01;  % 子图与图片右方的间距

%% PLOT
figure(1);  % 声明Figure
p = tight_subplot(TightPlot.ColumeNumber,TightPlot.RowNumber,...
    [TightPlot.GapH TightPlot.GapW],...
    [TightPlot.MarginsLower TightPlot.MarginsUpper],...
    [TightPlot.MarginsLeft TightPlot.MarginsRight]);    % 具体设置参数上一节已经输入了

for i = 1:6 % 输出6个图
     axes(p(i));    % 获取当前figure的信息
     ha{i} = plot(randn(100,i));    % 出图
     title(sprintf('Subfigure %d''s title',i)); % 子图i的标题
     xlabel(sprintf('Subfigure %d''s x-axis',i));   % 子图i的横轴标题
     ylabel(sprintf('Subfigure %d''s y-axis',i));   % 子图i的纵轴标题
end
set(p(1:4),'XTickLabel','');    % 抹去子图1-4的横轴数值
set(p([2,4,6]),'YTickLabel','') % 抹去子图2、4、6的纵轴数值

子图属性-get-set

去除轴坐标,重置title

set(f(2:length(name_space)), 'YTickLabel','') % 把2:... 子图的Y轴坐标去掉
set(f(length(name_space)+2:end), 'YTickLabel','') % 把...:end 子图的Y轴坐标去掉
set(f(1:length(name_space)), 'XTickLabel','')% 把1:... 子图的X轴坐标去掉
set(get(f(1), 'Ylabel'),'String', 'Distance Y /m') % 设置ylabel
set(get(f(length(name_space)+1), 'Ylabel'),'String', 'Distance Y /m') % 设置ylabel

maltab 图的大小

有时候需要控制图的大小,比如控制为2:1的矩形图,为了在论文里面大小一致,建议用代码实现

figure('Position', [500, 300, 560, 420]); % 一般matlab默认图的大小为 560*420 
figure('Position', [500, 300, 560, 560/2]); % 

matlab图局部放大

magnify.py函数,已经加到matlab库里了

function magnify(f1)
%
%magnify(f1)
%
%  Figure creates a magnification box when under the mouse
%  position when a button is pressed.  Press '+'/'-' while
%  button pressed to increase/decrease magnification. Press
%  '>'/'<' while button pressed to increase/decrease box size.
%  Hold 'Ctrl' while clicking to leave magnification on figure.
%
%  Example:
%     plot(1:100,randn(1,100),(1:300)/3,rand(1,300)), grid on,
%     magnify;

% Rick Hindman - 7/29/04

if (nargin == 0), f1 = gcf; end;
set(f1, ...
   'WindowButtonDownFcn',  @ButtonDownCallback, ...
   'WindowButtonUpFcn', @ButtonUpCallback, ...
   'WindowButtonMotionFcn', @ButtonMotionCallback, ...
   'KeyPressFcn', @KeyPressCallback);
return;

function ButtonDownCallback(src,eventdata)
   f1 = src;
   a1 = get(f1,'CurrentAxes');
   a2 = copyobj(a1,f1);

   set(f1, ...
      'UserData',[f1,a1,a2], ...
      'Pointer','fullcrosshair', ...
      'CurrentAxes',a2);
   set(a2, ...
      'UserData',[2,0.2], ...  %magnification, frame size
      'Color',get(a1,'Color'), ...
      'Box','on');
   xlabel(''); ylabel(''); zlabel(''); title('');
   set(get(a2,'Children'), ...
      'LineWidth', 2);
   set(a1, ...
      'Color',get(a1,'Color')*0.95);
   set(f1, ...
      'CurrentAxes',a1);
   ButtonMotionCallback(src);
return;

function ButtonUpCallback(src,eventdata)
   H = get(src,'UserData');
   f1 = H(1); a1 = H(2); a2 = H(3);
   set(a1, ...
      'Color',get(a2,'Color'));
   set(f1, ...
      'UserData',[], ...
      'Pointer','arrow', ...
      'CurrentAxes',a1);
   if ~strcmp(get(f1,'SelectionType'),'alt'),
      delete(a2);
   end;
return;

function ButtonMotionCallback(src,eventdata)
   H = get(src,'UserData');
   if ~isempty(H)
      f1 = H(1); a1 = H(2); a2 = H(3);
      a2_param = get(a2,'UserData');
      f_pos = get(f1,'Position');
      a1_pos = get(a1,'Position');

      [f_cp, a1_cp] = pointer2d(f1,a1);

      set(a2,'Position',[(f_cp./f_pos(3:4)) 0 0]+a2_param(2)*a1_pos(3)*[-1 -1 2 2]);
      a2_pos = get(a2,'Position');

   	set(a2,'XLim',a1_cp(1)+(1/a2_param(1))*(a2_pos(3)/a1_pos(3))*diff(get(a1,'XLim'))*[-0.5 0.5]);
   	set(a2,'YLim',a1_cp(2)+(1/a2_param(1))*(a2_pos(4)/a1_pos(4))*diff(get(a1,'YLim'))*[-0.5 0.5]);
   end;
return;

function KeyPressCallback(src,eventdata)
   H = get(gcf,'UserData');
   if ~isempty(H)
      f1 = H(1); a1 = H(2); a2 = H(3);
      a2_param = get(a2,'UserData');
      if (strcmp(get(f1,'CurrentCharacter'),'+') | strcmp(get(f1,'CurrentCharacter'),'='))
         a2_param(1) = a2_param(1)*1.2;
      elseif (strcmp(get(f1,'CurrentCharacter'),'-') | strcmp(get(f1,'CurrentCharacter'),'_'))
         a2_param(1) = a2_param(1)/1.2;
      elseif (strcmp(get(f1,'CurrentCharacter'),'<') | strcmp(get(f1,'CurrentCharacter'),','))
         a2_param(2) = a2_param(2)/1.2;
      elseif (strcmp(get(f1,'CurrentCharacter'),'>') | strcmp(get(f1,'CurrentCharacter'),'.'))
         a2_param(2) = a2_param(2)*1.2;
      end;
      set(a2,'UserData',a2_param);
   	ButtonMotionCallback(src);
   end;
return;


% Included for completeness (usually in own file)
function [fig_pointer_pos, axes_pointer_val] = pointer2d(fig_hndl,axes_hndl)
%
%pointer2d(fig_hndl,axes_hndl)
%
%	Returns the coordinates of the pointer (in pixels)
%	in the desired figure (fig_hndl) and the coordinates
%       in the desired axis (axes coordinates)
%
% Example:
%  figure(1),
%  hold on,
%  for i = 1:1000,
%     [figp,axp]=pointer2d;
%     plot(axp(1),axp(2),'.','EraseMode','none');
%     drawnow;
%  end;
%  hold off

% Rick Hindman - 4/18/01

if (nargin == 0), fig_hndl = gcf; axes_hndl = gca; end;
if (nargin == 1), axes_hndl = get(fig_hndl,'CurrentAxes'); end;

set(fig_hndl,'Units','pixels');

pointer_pos = get(0,'PointerLocation');	%pixels {0,0} lower left
fig_pos = get(fig_hndl,'Position');	%pixels {l,b,w,h}

fig_pointer_pos = pointer_pos - fig_pos([1,2]);
set(fig_hndl,'CurrentPoint',fig_pointer_pos);

if (isempty(axes_hndl)),
	axes_pointer_val = [];
elseif (nargout == 2),
	axes_pointer_line = get(axes_hndl,'CurrentPoint');
	axes_pointer_val = sum(axes_pointer_line)/2;
end;
  • 绘制完图像后,命令行输入magnify
  • 然后CTRL+鼠标左键选择放大位置
  • 保持左键,松开CTRL,(按住alt)通过- +键缩小放大图像
  • 在插入中插入箭头

20231206:

Magnify后EPS图可能会变糊(不知道在其他地方是否也是如此),原因是因为 如果图比较复杂,渲染器会变成OpenGL,要在导出设置里面修改为paintes就可以了

matlab绘图MAP

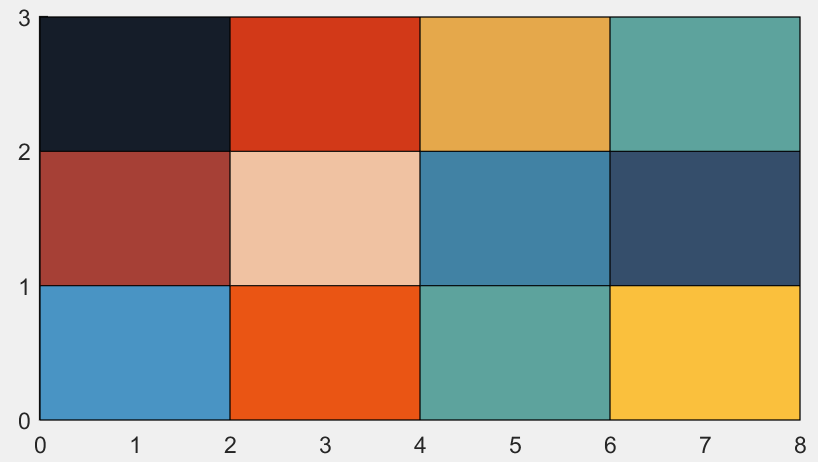
最近抖音学了几个配色还可以/颜色/配色/plot:

color_map1 = [[21,29,41];[210,57,24];[229,168,075];[093,163,157]]./255;
color_map2 = [[166,64,54];[240,194,162];[065,130,164];[053,078,107]]./255;
color_map3 = [[073,148,196];[234,085,020];[093,163,157];[250,192,061]]./255;

最常用color_map3

对照表:

colormap

clc;clear;close all;
color_map1 = [[21,29,41];[210,57,24];[229,168,075];[093,163,157]]./255;
color_map2 = [[166,64,54];[240,194,162];[065,130,164];[053,078,107]]./255;
color_map3 = [[073,148,196];[234,085,020];[093,163,157];[250,192,061]]./255;

x_num = 4; % 横4
y_num = 3; % 竖3

x_len = 2; % 横长2
y_len = 1; % 竖长1
figure(1)
hold on;
for ix=1:x_num
    for iy = 1:y_num
        choose_x = [(ix-1)*x_len, ix*x_len, ix*x_len, (ix-1)*x_len];
        choose_y = [(y_num-iy)*y_len, (y_num-iy)*y_len, (y_num-iy+1)*y_len, (y_num-iy+1)*y_len];
        if iy == 1
            color_map = color_map1;
        elseif iy == 2
            color_map = color_map2;
        elseif iy == 3
            color_map = color_map3;
        else
            fprintf('Error');
        end
        fill(choose_x, choose_y, color_map(ix, :));
    end
end
hold off;

yticks([0, 1, 2, 3])

matlab横纵坐标及图例

值得注意的是,横纵坐标和图例最好都用latex编译器,设置方式如下:

h1 = legend('MISO, $$M=4,k_h=1,k_G=0$$', 'MISO, $$M=8,k_h=1,k_G=0$$', 'MISO, $$M=16,k_h=1,k_G=0$$','MISO, $$M=32,k_h=1,k_G=0$$','SISO,$$k_h=1,k_G=0$$');
set(h1, 'Interpreter', 'latex')
xlim([min(N_all), max(N_all)]);
xlabel('Number of IRS elements', 'Interpreter', 'latex');
ylabel('Outage Probability', 'Interpreter', 'latex')
set(gca,'Fontname', 'Times New Roman');

三个'Interpreter', latex

数据读取

matlab自带load读取数据是结构体,不够方便。使用自定义函数,第一个参数为文件路径,第二个参数为保存时的变量名,返回数据。

function out = myload(path, name)
    data = load(path);
    out = eval(['data.', name]);
end

20230506更新,不需要name,增加输入检测,未实现文件名自动提示功能

function out = myload(path)
    path_buff = char(path);
    if path_buff(end-3:end) ~= '.mat'
        path = [path, '.mat'];
    end
    a = inputParser;
    addRequired(a, 'path', @isfile);
    parse(a, path);

    data = load(path);
    name = cell2mat(fieldnames(data));
    out = eval(['data.', name]);
end

三维图EPS模糊的问题

https://blog.csdn.net/QWERTYUIOPPLM123/article/details/108540242


20241009:

matlab painters不支持透明,openGL三维模糊

  1. matlab另存为SVG
  2. Inkscape另存为eps

Matlab 安装和CVX

maltab 安装

  • 管理员权限setup.exe
  • 密钥:

    • 2021b: 62551-02011-26857-57509-64399-54230-13279-37181-62117-65158-40352-64197-45508-24369-45954-39446-39538-16936-10698-58393-44718-32560-10501-40058-34454
    • 2022a: 50874-33247-14209-37962-45495-25133-28159-33348-18070-60881-29843-35694-31780-18077-36759-35464-51270-19436-54668-35284-27811-01134-26918-26782-54088
  • 证书:Crack文件夹下license.lic文件

  • 将libmwlmgrimpl.dll复制到安装目录R2021/bin/win64/matlab_startup_plugins/lmgrimpl下,并替换
  • 更改初始文件夹/默认文件夹/初始路径/默认路径

image-20230224125933279

CVX安装

  • 官网下载
  • 解压到某一个文件夹
  • matlab工作区,cd到该位置
  • cvx_setup