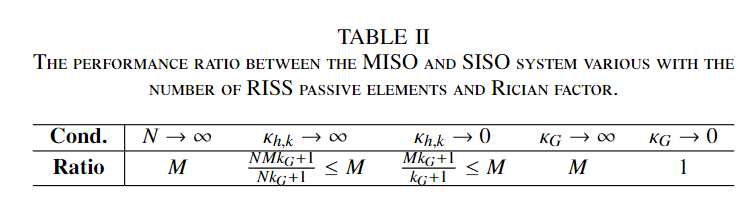
\begin{table}[] \centering \caption{The performance ratio between the MISO and SISO system various with the number of RISS passive elements and Rician factor.} \begin{tabular}{c|ccccc} \hline % \toprule \textbf{Cond.} &$N\to\infty$&$\kappa_{h,k}\to\infty$&$\kappa_{h,k}\to 0$&$\kappa_G\to\infty$&$\kappa_G\to 0$\\ \hline \textbf{Ratio}&$M$&$\frac{NMk_{G}+1}{Nk_{G}+1}\leq M$&$\frac{Mk_{G}+1}{k_{G}+1}\leq M$&$M$&$1$\\ \hline \end{tabular} \label{table:condratio} \end{table}
Number the figures in the order shown in the manuscript
1 2 3 4 5 6 7 8 9 10
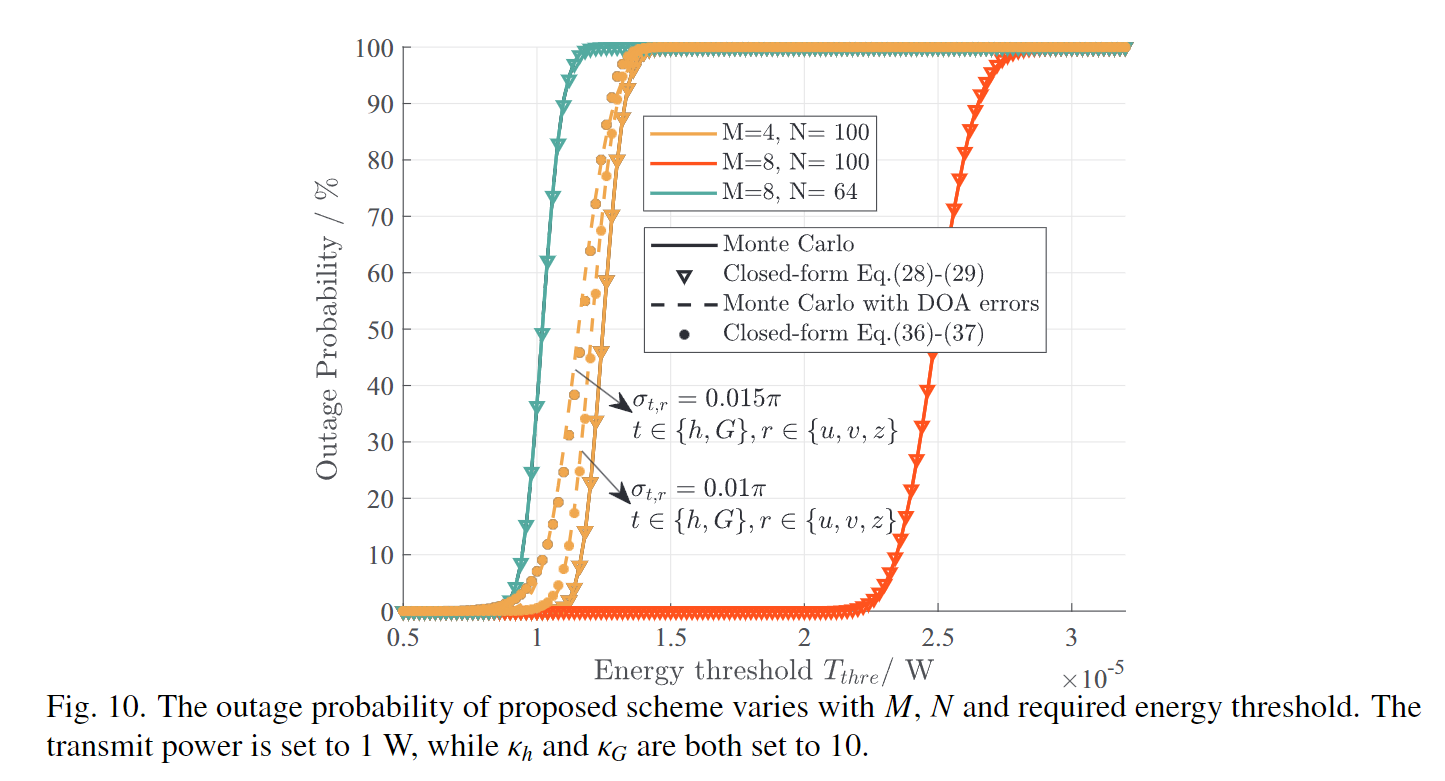
\counterwithout{figure}{section} \setcounter{figure}{9} \begin{figure} \centering \includegraphics[width=0.6\linewidth]{pic/exp5_1.eps} \setlength{\abovecaptionskip}{0pt} \setlength{\belowcaptionskip}{0pt} \caption{The outage probability of proposed scheme varies with $M$, $N$ and required energy threshold. The transmit power is set to 1 W, while $\kappa_h$ and $\kappa_G$ are both set to 10.} \label{fig:exp5} \end{figure}
image-20231020200710898
Number the figures in the order shown in the Response
1 2 3 4 5 6 7 8
\counterwithin{figure}{section} \begin{figure}[!t] \centering \setlength{\abovecaptionskip}{0pt} \setlength{\belowcaptionskip}{0pt} \includegraphics [width=0.4\linewidth]{pic/angleRecip.eps} \caption{The incident angle (i.e., AOA) for the uplink is represented by $\theta_1$, while the reflection angle (i.e., AOD) is represented by $\theta_2$. Similarly, the incidence and reflection angles for the downlink are represented by $\theta_3$ and $\theta_1$, respectively}\label{fig:angleRecip} \end{figure}
image-20231020200759673
Multiple figures
1 2 3 4 5 6 7 8 9 10 11 12 13 14
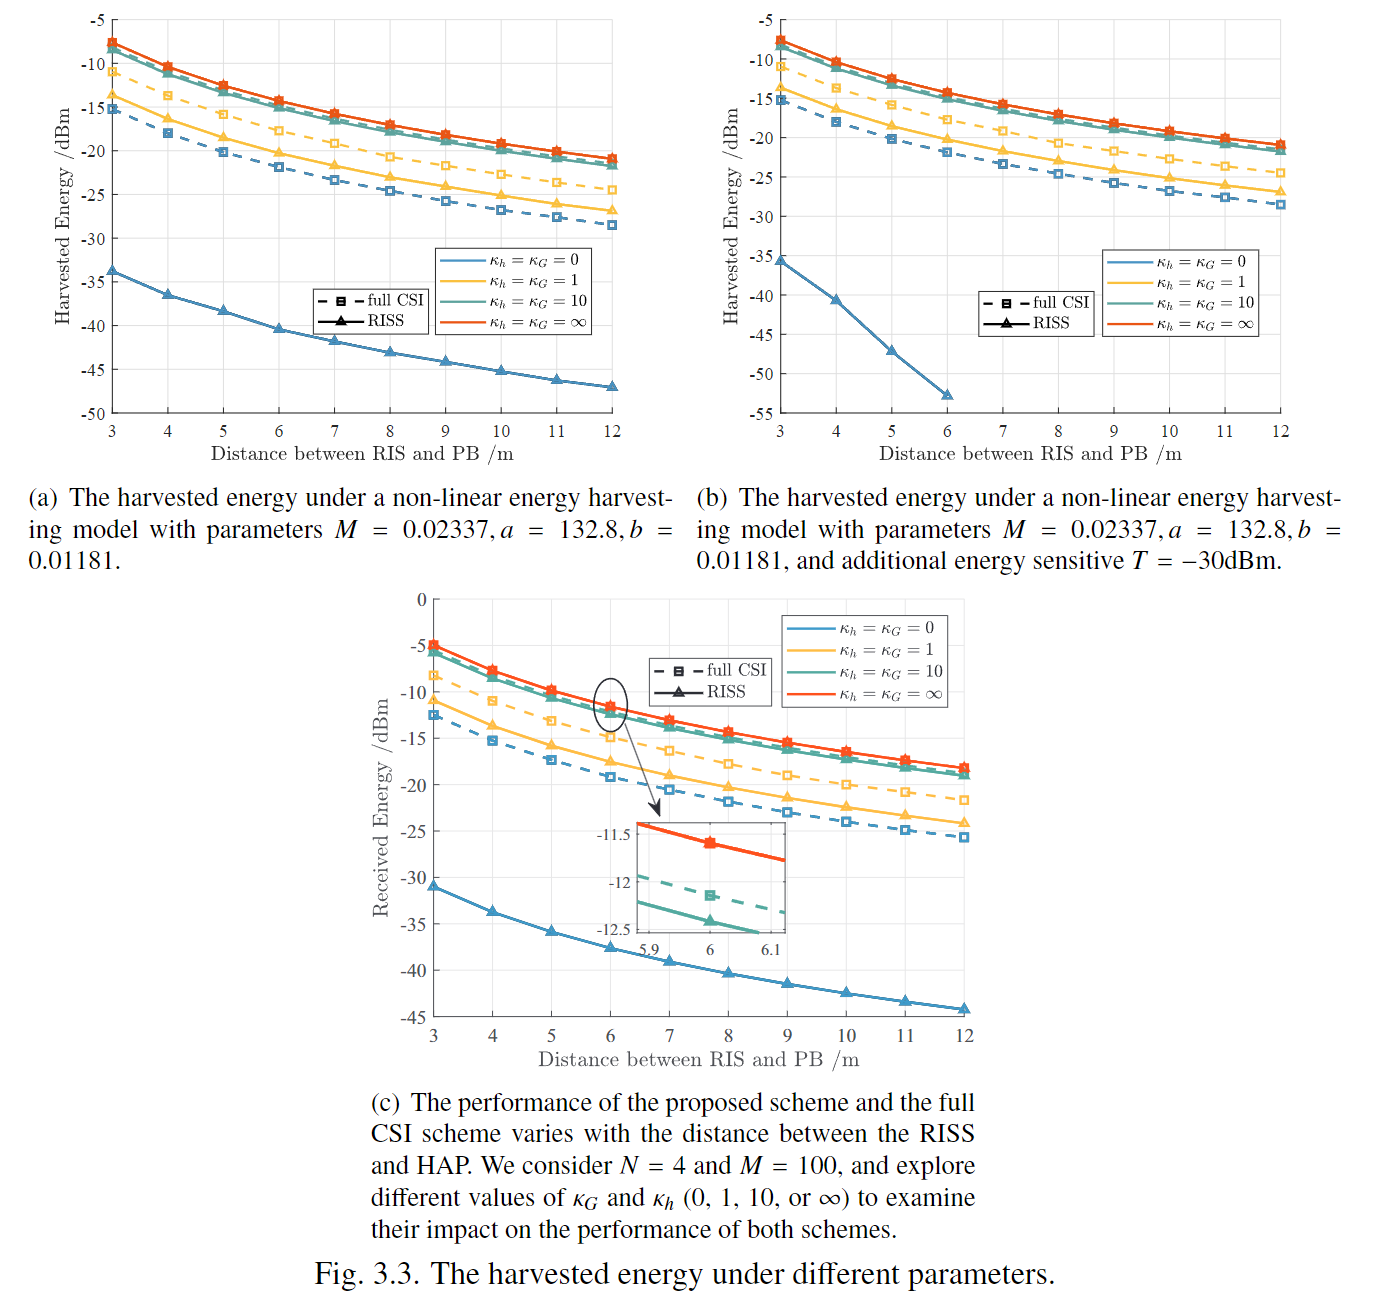
\counterwithin{figure}{section}
\begin{figure}[!t]
	\centering
	{
		\subfigure[The harvested energy under a non-linear energy harvesting model with parameters $M=0.02337, a= 132.8, b = 0.01181$.]{\includegraphics[width = 0.48\linewidth]{pic/EnergywithNonlinear.eps}}
		\hfil
		\subfigure[The harvested energy under a non-linear energy harvesting model with parameters $M=0.02337, a= 132.8, b = 0.01181$, and additional energy sensitive $T=-30$dBm.]{\includegraphics[width = 0.48\linewidth]{pic/EnergywithNonlinearSensitive.eps}}
		\subfigure[The performance of the proposed scheme and the full CSI scheme varies with the distance between the RISS and HAP. We consider $N=4$ and $M=100$, and explore different values of $\kappa_G$ and $\kappa_h$ (0, 1, 10, or $\infty$) to examine their impact on the performance of both schemes.]{\includegraphics[width = 0.45\linewidth]{pic/exp3.eps}}
	}
	\setlength{\abovecaptionskip}{0pt}
	\setlength{\belowcaptionskip}{0pt}
	\caption{The harvested energy under different parameters.}
	\label{fig:3.7}
\end{figure}
image-20231020200909199
Some optional expressions
Entire:
Many thanks for your valuable comments.
Many thanks for your positive comment.
Many thanks for your accurate summarization.
Many thanks for seeking more explanation.
Many thanks for your constructive comment.
Many thanks for your valuable comments.
Many thanks for observing this flaw.
Many thanks for your constructive advice.
Many thanks for your kind advice.
Many thanks for seeking more justifications.
Many thanks for raising this concern
Specifically, the following descriptions have been added in Section II-C to explain how the DT is implemented
The corresponding performance comparison is illustrated in Figs. 7 and 8 of the revised manuscript, which is copied here along with the descriptions for your convenience
The corresponding description has been added in Section IV-D of the revised manuscript, which is copied here for your convenience: